In today’s digital world, every industry runs on data. Whether it’s retail, healthcare, finance, education, or manufacturing, organizations are collecting massive amounts of information from customers, employees, devices, and markets. But raw data by itself is just noise. The real value comes from how businesses manage the data journey — the process of transforming raw inputs into insights and actions.
In this blog, we’ll explore the key datasets common across industries and walk through a generic data architecture that applies to any modern enterprise.
1. What Data Looks Like in Any Industry
Every sector may have its own flavor of data, but the categories are surprisingly universal:
a) Core Business Data
The heart of operations:
- Customers, clients, or citizens
- Products, services, or assets
- Transactions (sales, claims, usage, bookings)
- Operational data (supply chain, logistics, manufacturing steps)
b) People & Workforce Data
Every organization runs on people:
- Employees, contractors, partners
- Skills, performance, training, and payroll
c) Financial & Compliance Data
The foundation for accountability:
- Revenue, expenses, P&L statements
- Billing, invoicing, and pricing
- Audit and regulatory data
d) External & Contextual Data
The outside world adds context:
- Market and competitor data
- Economic indicators
- Weather, IoT sensors, or geospatial data
- Social media, customer feedback, public datasets
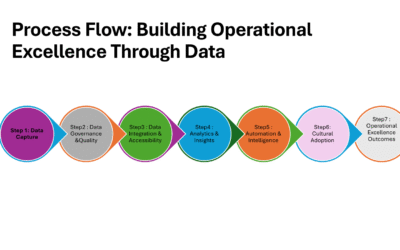
2. The Data Journey: From Raw Inputs to Intelligent Outcomes
Here’s how the data lifecycle typically flows in any enterprise:
Step 1: Data Sources
Enterprise systems (ERP, CRM, HR, SCM), websites, apps, IoT devices, and external APIs feed data into the ecosystem.
Step 2: Data Ingestion
Data enters the architecture via:
- Batch ETL (daily/weekly jobs)
- Streaming ingestion (real-time events like clickstream or IoT signals)
- APIs and integrations with external partners or SaaS tools
Step 3: Data Lake (Raw Zone)
A central landing zone for all raw data, flexible enough to handle structured, semi-structured, and unstructured formats.
Step 4: Processing & Transformation
Data is cleaned, standardized, and enriched. This step integrates data across silos (ERP + CRM + external feeds) to create a single version of the truth.
Step 5: Data Warehouse & Data Marts
Curated datasets are stored in structured formats optimized for reporting and analytics. Think of this as the “organized library” compared to the messy storage room of the raw data lake.
Step 6: Analytics & Business Intelligence
Dashboards, KPIs, and reports provide descriptive and diagnostic insights. Business users can monitor performance and make data-driven decisions.
Step 7: Advanced Analytics & AI
Predictive and prescriptive analytics unlock higher value:
- Demand forecasting
- Customer churn prediction
- Recommendation engines
- Risk scoring and automation
Step 8: Governance, Privacy & Security
No journey is complete without rules. Data governance ensures quality, ownership, and compliance (GDPR, HIPAA, industry standards). Security measures protect sensitive information.
Step 9: Data Sharing & APIs
Finally, data is made useful across the ecosystem: partners, regulators, marketplaces, or customers via secure APIs.
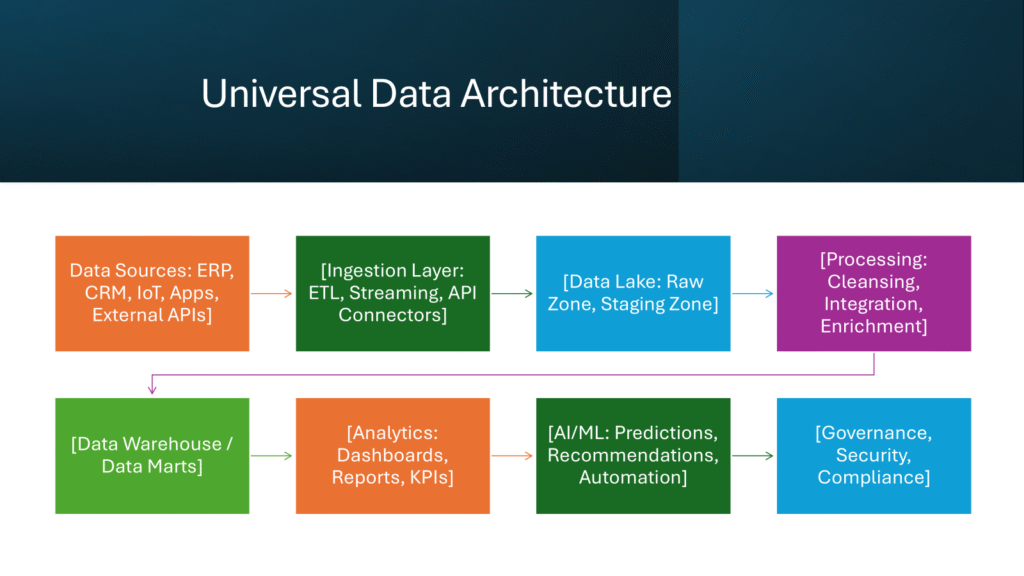
3. A Universal Data Architecture
Here’s the big picture of how it all fits together:
4. Why This Matters
By following this data journey, organizations can:
- Break down silos between departments
- Improve decision-making with real-time insights
- Enhance customer and employee experiences
- Ensure compliance and trust
- Build scalable AI-driven capabilities
No matter the industry, the path from raw data to business value is the same. What differs is the domain-specific context — whether you’re analyzing patient outcomes, optimizing a supply chain, or predicting student success.
✅ Key takeaway: Data is no longer a by-product of business — it is the business. Companies that master the data journey are the ones that stay competitive, innovative, and future-ready.